Время на прочтение
3 мин
Количество просмотров 197K
Если вы словили OutOfMemoryError, то это вовсе не значит, что ваше приложение создает много объектов, которые не могут почиститься сборщиком мусора и заполняют всю память, выделенную вами с помощью параметра -Xmx. Я, как минимум, могу придумать два других случая, когда вы можете увидеть эту ошибку. Дело в том, что память java процесса не ограничивается областью -Xmx, где ваше приложение программно создает объекты.
Область памяти, занимаемая java процессом, состоит из нескольких частей. Тип OutOfMemoryError зависит от того, в какой из них не хватило места.
1. java.lang.OutOfMemoryError: Java heap space
Не хватает место в куче, а именно, в области памяти в которую помещаются объекты, создаваемые программно в вашем приложении. Размер задается параметрами -Xms и -Xmx. Если вы пытаетесь создать объект, а места в куче не осталось, то получаете эту ошибку. Обычно проблема кроется в утечке памяти, коих бывает великое множество, и интернет просто пестрит статьями на эту тему.
2. java.lang.OutOfMemoryError: PermGen space
Данная ошибка возникает при нехватке места в Permanent области, размер которой задается параметрами -XX:PermSize и -XX:MaxPermSize. Что там лежит и как бороться с OutOfMemoryError возникающей там, я уже описал подробнейшим образом тут.
3. java.lang.OutOfMemoryError: GC overhead limit exceeded
Данная ошибка может возникнуть как при переполнении первой, так и второй областей. Связана она с тем, что памяти осталось мало и GC постоянно работает, пытаясь высвободить немного места. Данную ошибку можно отключить с помощью параметра -XX:-UseGCOverheadLimit, но, конечно же, её надо не отключать, а либо решать проблему утечки памяти, либо выделять больше объема, либо менять настройки GC.
4. java.lang.OutOfMemoryError: unable to create new native thread
Впервые я столкнулся с данной ошибкой несколько лет назад, когда занимался нагрузочным тестированием и пытался выяснить максимальное количество пользователей, которые могут работать с нашим веб-приложением. Я использовал специальную тулзу, которая позволяла логинить пользователей и эмулировать их стандартные действия. На определенном количестве клиентов, я начал получать OutOfMemoryError. Не особо вчитываясь в текст сообщения и думая, что мне не хватает памяти на создание сессии пользователя и других необходимых объектов, я увеличил размер кучи приложения (-Xmx). Каково же было мое удивление, когда после этого количество пользователей одновременно работающих с системой только уменьшилось. Давайте подробно разберемся как же такое получилось.
На самом деле это очень просто воспроизвести на windows на 32-битной машине, так как там процессу выделяется не больше 2Гб.
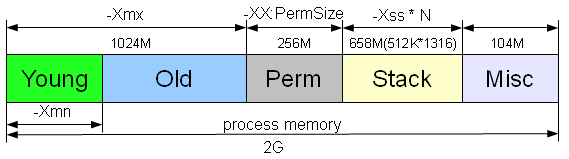
Допустим у вас есть приложение с большим количеством одновременно работающих пользователей, которое запускается с параметрами -Xmx1024M -XX:MaxPermSize=256M -Xss512K. Если всего процессу доступно 2G, то остается свободным еще коло 768M. Именно в данном остатке памяти и создаются стеки потоков. Таким образом, примерно вы можете создать не больше 768*(1024/512)=1536 (у меня при таких параметрах получилось создать 1316) нитей (см. рисунок в начале статьи), после чего вы получите OutOfMemoryError. Если вы увеличиваете -Xmx, то количество потоков, которые вы можете создать соответственно уменьшается. Вариант с уменьшением -Xss, для возможности создания большего количества потоков, не всегда выход, так как, возможно, у вас существуют в системе потоки требующие довольно больших стеков. Например, поток инициализации или какие-нибудь фоновые задачи. Но все же выход есть. Оказывается при программном создании потока, можно указать размер стека: Thread(ThreadGroup group, Runnable target, String name,long stackSize). Таким образом вы можете выставить -Xss довольно маленьким, а действия требующие больших стеков, выполнять в отдельных потоках, созданных с помощью упомянутого выше конструктора.
Более подробно, что же лежит в стеке потока, и куда уходит эта память, можно прочитать тут.
Конечно, вам может показаться данная проблема слегка надуманной, так как большинство серверов нынче крутиться на 64-битной архитектуре, но все же считаю данный пример весьма полезным, так как он помогает разобраться из каких частей состоит память java-процесса.
If you keep on allocating & keeping references to object, you will fill up any amount of memory you have.
One option is to do a transparent file close & open when they switch tabs (you only keep a pointer to the file, and when the user switches tab, you close & clean all the objects… it’ll make the file change slower… but…), and maybe keep only 3 or 4 files on memory.
Other thing you should do is, when the user opens a file, load it, and intercept any OutOfMemoryError, then (as it is not possible to open the file) close that file, clean its objects and warn the user that he should close unused files.
Your idea of dynamically extending virtual memory doesn’t solve the issue, for the machine is limited on resources, so you should be carefull & handle memory issues (or at least, be carefull with them).
A couple of hints i’ve seen with memory leaks is:
—> Keep on mind that if you put something into a collection and afterwards forget about it, you still have a strong reference to it, so nullify the collection, clean it or do something with it… if not you will find a memory leak difficult to find.
—> Maybe, using collections with weak references (weakhashmap…) can help with memory issues, but you must be carefull with it, for you might find that the object you look for has been collected.
—> Another idea i’ve found is to develope a persistent collection that stored on database objects least used and transparently loaded. This would probably be the best approach…
Overview
An out of memory error in Java formally known as java.lang.OutOfMemoryError is a runtime error that occurs when the Java Virtual Machine (JVM) cannot allocate an object in the Java heap memory. In this article, we will be discussing several reasons behind “out of memory” errors in Java and how you can avoid them.

The JVM manages the memory by setting aside a specific size of the heap memory to store the newly allocated objects. All the referenced objects remain active in the heap and keep that memory occupied until their reference is closed. When an object is no longer referenced, it becomes eligible to be removed from the heap by the Garbage collector to free up the occupied heap memory. In certain cases, the Java Garbage Collector (GC) is unable to free up the space required for a new object and the available heap memory is insufficient to support the loading of a Java class, this is when an “out of memory” error occurs in Java.
What causes the out of memory error in Java?
An “out of memory” error in Java is not that common and is a direct indication that something is wrong in the application. For instance, the application code could be referencing large objects for too long that is not required or trying to process large amounts of data at a time. It is even possible that the error could have nothing to do with objects on the heap and the reason behind it like because of third-party libraries used within an application or due to an application server that does not clean up after deployment.
Following are some of the main causes behind the unavailability of heap memory that cause the out of memory error in Java.
· Java heap space error
It is the most common out of memory error in Java where the heap memory fills up while unable to remove any objects.
See the code snippet below where java.lang.OutOfMemoryError is thrown due to insufficient Java heap memory available:
public class OutOfMemoryError01 {
    public static void main(String[] args) {
        Integer[] arr = new Integer[1000 * 1000 * 1000];
    }
}
Output:
Exception in thread "main" java.lang.OutOfMemoryError: Java heap space
    at OutOfMemoryErrorExample.main(OutOfMemoryErrorExample.java:8)
In the above code, an array of integers with a very large size is attempted to be initialized. As the Java heap is insufficient to allocate such a huge array, it will eventually throw a java.lang.OutOfMemoryError: Java heap space error. Initially, it might seem fine but over time, it will result in consuming a lot of Java heap space and when it fills all of the available memory in the heap, Garbage Collection will not be able to clean it as the code would still be in execution and the no memory can be freed.
Another reason for a Java heap space error is the excessive use of finalizers. If a class has a finalize() method, the GC will not clean up any objects of that class, instead, they all will be queued up for finalization at a later stage. If a finalizer thread cannot keep up with the finalization queue because of excessive usage of finalizers, the Java heap will eventually fill up resulting in an “out of memory” error in Java.
Prevention:
Developers need to use the finalize methods only when required and they must monitor all the objects for which finalization would be pending.
· GC Overhead limit exceeded:
This error indicates that the garbage collector is constantly running due to which the program will also be running very slowly. In a scenario where for minimum consecutive 5 garbage collection cycles, if a Java process utilizes almost 98% of its time for garbage collection and could recover less than 2% of the heap memory then a Java Out of Memory Error will be thrown.
This error typically occurs because the newly generated data could barely fit into the Java heap memory having very little free space for new object allocations.
Prevention:
Java developers have the option to set the heap size by themselves. To prevent this error, you must Increase the heap size using the -Xmx attribute when launching the JVM.
· PermGen space error:
JVM separates the memory into different sections. One of the sections is Permanent Generation (PermGen) space. It is used to load the definitions of new classes that are generated at the runtime. The size of all these sections, including the PermGen area, is set at the time of the JVM launch. If you do not set the sizes of every area yourself, platform-specific defaults sizes will be then set. If the Permanent Generation’s area is ever exhausted, it will throw the java.lang.OutOfMemoryError: PermGen space error.
Prevention:
The solution to this out of Memory Error in Java is fairly simple. The application just needs more memory to load all the classes to the PermGen area so just like the solution for GC overhead limit exceeding error, you have to increase the size of the PermGen region at the time of Java launch. To do so, you have to change the application launch configuration and increase or if not used, add the –XX:MaxPermSize parameter to your code.
· Out of MetaSpace error:
All the Java class metadata is allocated in native memory (MetaSpace). The amount of MetaSpace memory to be used for class metadata is set by the parameter MaxMetaSpaceSize. When this amount exceeds, a java.lang.OutOfMemoryError exception with a detail MetaSpace is thrown.
Prevention:
If you have set the MaxMetaSpaceSize on the command line, increasing its size manually can solve the problem. Alternatively, MetaSpace is allocated from the same address spaces as the Java heap memory so by reducing the size of the Java heap, you can automatically make space available for MetaSpace. It should only be done when you have excess free space in the Java heap memory or else you can end up with some other Java out of memory error.
· Out of swap space error:
This error is often occurred due to certain operating system issues, like when the operating system has insufficient swap space or a different process running on the system is consuming a lot of memory resources.
Prevention:
There is no way to prevent this error as it has nothing to do with heap memory or objects allocation. When this error is thrown, the JVM invokes the error handling mechanism for fatal errors. it generates an error log file, which contains all the useful information related to the running threads, processes, and the system at the time of the crash. this log information can be very useful to minimize any loss of data.
How to Catch java.lang.OutOfMemoryError?
As the java.lang.OutOfMemoryError is part of the Throwable class, it can be caught and handled in the application code which is highly recommended. The handling process should include the clean up the resources, logging the last data to later identify the reason behind the failure, and lastly, exit the program properly.
See this code example below:
public class OutOfMemoryError02 {
    public void createArr (int size) {
        try {
            Integer[] myArr = new Integer[size];
        } catch (OutOfMemoryError ex) {
            //creating the Log
            System.err.println("Array size is too large");
            System.err.println("Maximum JVM memory: " +
Runtime.getRuntime().maxMemory());
        }
    }
    public static void main(String[] args) {
        OutOfMemoryError02 oomee = new OutOfMemoryError02();
        ex.createArr (1000 * 1000 * 1000);
    }
}
In the above code, as the line of code that might cause an out of Memory Error is known, it is handled using a try-catch block. In case, if the error occurs, the reason for the error will be logged that is the large size of the array and the maximum size of the JVM, which will be later helpful for the caller of the method to take the action accordingly.
In case of an out of memory error, this code will exit with the following message:
Array size is too large
Maximum JVM memory: 9835679212
It is also a good option to handle an out of Memory Error in Java when the application needs to stay in a constant state in case of the error. This allows the application to keep running normally if any new objects are not required to be allocated.
See Also: CompletableFuture In Java With Examples
Conclusion
In this article, we have extensively covered everything related to the “out of memory” error in Java. In most cases, you can now easily prevent the error or at least will be able to retrieve the required information after the crashing of the program to identify the reason behind it. Managing errors and exceptions in your code is always challenging but being able to understand and avoid these errors can help you in making your applications stable and robust.

In Java, all objects are stored in a heap. They are allocated using a new operator. The OutOfMemoryError Exception in Java looks like this:
Exception in thread "main" java.lang.OutOfMemoryError: Java heap space
Usually, this error is thrown when the Java Virtual Machine cannot allocate an object because it is out of memory. No more memory could be made available by the garbage collector.
OutOfMemoryError usually means that you’re doing something wrong, either holding onto objects too long or trying to process too much data at a time. Sometimes, it indicates a problem that’s out of your control, such as a third-party library that caches strings or an application server that doesn’t clean up after deploys. And sometimes, it has nothing to do with objects on the heap.
The java.lang.OutOfMemoryError exception can also be thrown by native library code when a native allocation cannot be satisfied (for example, if swap space is low). Let us understand various cases when the OutOfMemory error might occur.
Symptom or Root cause?
To find the cause, the text of the exception includes a detailed message at the end. Let us examine all the errors.
Error 1 – Java heap space:
This error arises due to the applications that make excessive use of finalizers. If a class has a finalize method, objects of that type do not have their space reclaimed at garbage collection time. Instead, after garbage collection, the objects are queued for finalization, which occurs later.
Implementation:
- finalizers are executed by a daemon thread that services the finalization queue.
- If the finalizer thread cannot keep up with the finalization queue, the Java heap could fill up, and this type of OutOfMemoryError exception would be thrown.
- The problem can also be as simple as a configuration issue, where the specified heap size (or the default size, if it is not specified) is insufficient for the application.
Java
import java.util.*;
public class Heap {
static List<String> list = new ArrayList<String>();
public static void main(String args[]) throws Exception
{
Integer[] array = new Integer[10000 * 10000];
}
}
Output:
Exception in thread "main" java.lang.OutOfMemoryError: Java heap space
    at Heap.main(Heap.java:11)
When you execute the above code above you might expect it to run forever without any problems. As a result, over time, with the leaking code constantly used, the “cached” results end up consuming a lot of Java heap space, and when the leaked memory fills all of the available memory in the heap region and Garbage Collection is not able to clean it, the java.lang.OutOfMemoryError:Java heap space is thrown.
Prevention: Check how to monitor objects for which finalization is pending in Monitor the Objects Pending Finalization.
Error 2 – GC Overhead limit exceeded:
This error indicates that the garbage collector is running all the time and Java program is making very slow progress. After a garbage collection, if the Java process is spending more than approximately 98% of its time doing garbage collection and if it is recovering less than 2% of the heap and has been doing so far the last 5 (compile-time constant) consecutive garbage collections, then a java.lang.OutOfMemoryError is thrown.
This exception is typically thrown because the amount of live data barely fits into the Java heap having little free space for new allocations.
Java
import java.util.*;
public class Wrapper {
public static void main(String args[]) throws Exception
{
Map m = new HashMap();
m = System.getProperties();
Random r = new Random();
while (true) {
m.put(r.nextInt(), "randomValue");
}
}
}
If you run this program with java -Xmx100m -XX:+UseParallelGC Wrapper, then the output will be something like this :
Exception in thread "main" java.lang.OutOfMemoryError: GC overhead limit exceeded
    at java.lang.Integer.valueOf(Integer.java:832)
    at Wrapper.main(error.java:9)
Prevention: Increase the heap size and turn off it with the command line flag -XX:-UseGCOverheadLimit.
Error 3 – Permgen space is thrown:
Java memory is separated into different regions. The size of all those regions, including the permgen area, is set during the JVM launch. If you do not set the sizes yourself, platform-specific defaults will be used.
The java.lang.OutOfMemoryError: PermGen space error indicates that the Permanent Generation’s area in memory is exhausted.
Java
import javassist.ClassPool;
public class Permgen {
static ClassPool classPool = ClassPool.getDefault();
public static void main(String args[]) throws Exception
{
for (int i = 0; i < 1000000000; i++) {
Class c = classPool.makeClass("com.saket.demo.Permgen" + i).toClass();
System.out.println(c.getName());
}
}
}
In the above sample code, code iterates over a loop and generates classes at run time. Class generation complexity is being taken care of by the Javassist library.
Running the above code will keep generating new classes and loading their definitions into Permgen space until the space is fully utilized and the java.lang.OutOfMemoryError: Permgen space is thrown.
Prevention : When the OutOfMemoryError due to PermGen exhaustion is caused during the application launch, the solution is simple. The application just needs more room to load all the classes to the PermGen area, so we need to increase its size. To do so, alter your application launch configuration and add (or increase if present) the -XX:MaxPermSize parameter similar to the following example:
java -XX:MaxPermSize=512m com.saket.demo.Permgen
Error 4 – Metaspace:
Java class metadata is allocated in native memory. Suppose metaspace for class metadata is exhausted, a java.lang.OutOfMemoryError exception with a detail MetaSpace is thrown.
The amount of metaspace used for class metadata is limited by the parameter MaxMetaSpaceSize, which is specified on the command line. When the amount of native memory needed for a class metadata exceeds MaxMetaSpaceSize, a java.lang.OutOfMemoryError exception with a detail MetaSpace is thrown.
Java
import java.util.*;
public class Metaspace {
static javassist.ClassPool cp
= javassist.ClassPool.getDefault();
public static void main(String args[]) throws Exception
{
for (int i = 0; i < 100000; i++) {
Class c = cp.makeClass(
"com.saket.demo.Metaspace" + i)
.toClass();
}
}
}
This code will keep generating new classes and loading their definitions to Metaspace until the space is fully utilized and the java.lang.OutOfMemoryError: Metaspace is thrown. When launched with -XX:MaxMetaspaceSize=64m then on Mac OS X my Java 1.8.0_05 dies at around 70, 000 classes loaded.
Prevention: If MaxMetaSpaceSize, has been set on the command line, increase its value. MetaSpace is allocated from the same address spaces as the Java heap. Reducing the size of the Java heap will make more space available for MetaSpace. This is only a correct trade-off if there is an excess of free space in the Java heap.
Error 5 – Requested array size exceeds VM limit:
This error indicates that the application attempted to allocate an array that is larger than the heap size. For example, if an application attempts to allocate an array of 1024 MB but the maximum heap size is 512 MB then OutOfMemoryError will be thrown with “Requested array size exceeds VM limit”.
Java
import java.util.*;
public class GFG {
static List<String> list = new ArrayList<String>();
public static void main(String args[]) throws Exception
{
Integer[] array = new Integer[10000 * 10000];
}
}
Output:
Exception in thread "main" java.lang.OutOfMemoryError: Java heap space
    at GFG.main(GFG.java:12)
The java.lang.OutOfMemoryError: Requested array size exceeds VM limit can appear as a result of either of the following situations:
- Your arrays grow too big and end up having a size between the platform limit and the Integer.MAX_INT
- You deliberately try to allocate arrays larger than 2^31-1 elements to experiment with the limits.
Error 6 – Request size bytes for a reason. Out of swap space?:
This apparent exception occurred when an allocation from the native heap failed and the native heap might be close to exhaustion. The error indicates the size (in bytes) of the request that failed and the reason for the memory request. Usually, the reason is the name of the source module reporting the allocation failure, although sometimes it is the actual reason.
The java.lang.OutOfMemoryError: Out of swap space error is often caused by operating-system-level issues, such as:
- The operating system is configured with insufficient swap space.
- Another process on the system is consuming all memory resources.
Prevention: When this error message is thrown, the VM invokes the fatal error handling mechanism (that is, it generates a deadly error log file, which contains helpful information about the thread, process, and system at the time of the crash). In the case of native heap exhaustion, the heap memory and memory map information in the log can be useful.
Error 7 – reason stack_trace_with_native_method:
Whenever this error message(reason stack_trace_with_native_method) is thrown then a stack trace is printed in which the top frame is a native method, then this is an indication that a native method has encountered an allocation failure. The difference between this and the previous message is that the allocation failure was detected in a Java Native Interface (JNI) or native method rather than the JVM code.
Java
import java.util.*;
public class GFG {
public static void main(String args[]) throws Exception
{
while (true) {
new Thread(new Runnable() {
public void run()
{
try {
Thread.sleep(1000000000);
}
catch (InterruptedException e) {
}
}
}).start();
}
}
}
The exact native thread limit is platform-dependent. For example, tests Mac OS X reveals that: 64-bit Mac OS X 10.9, Java 1.7.0_45 – JVM dies after #2031 threads have been created
Prevention: Use native utilities of the OS to diagnose the issue further. For more information about tools available for various operating systems, see Native Operating System tools.
This article is contributed by Saket Kumar. If you like GeeksforGeeks and would like to contribute, you can also write an article using write.geeksforgeeks.org or mail your article to review-team@geeksforgeeks.org. See your article appearing on the GeeksforGeeks main page and help other Geeks. Please write comments if you find anything incorrect, or you want to share more information about the topic discussed above.
The OutOfMemoryError is a common issue in Java applications, occurring when the JVM cannot allocate enough memory to fulfill a request. The OutOfMemoryError can lead to application crashes and affect overall performance. Proper memory management is critical in preventing it.
This article provides insights and strategies to handle and prevent this error in Java applications, ensuring efficient memory usage and optimal application performance.
The OutOfMemoryError class is present in ‘java.lang‘ package and has been there since Java version 1.0. It extends VirtualMachineError class; hence, it is an unchecked exception, and we don’t have to declare it in a method or a constructor throws clause.
This issue is more due to the system’s limitation (heap memory space) rather than due to the programming mistakes made by the developer.
Constructors defined in this class:
OutOfMemoryError():Creates an instance of the OutOfMemoryError class, setting null as its message.OutOfMemoryError(String message):Creates an instance of the OutOfMemoryError class, using the specified message.
2. Various Causes and Fixtures For OutOfMemoryError
OutOfMemoryError occurs when something is wrong in the application either the application code references large-size objects for a longer time than necessary or the user tries to process larger amounts of data in memory at a certain point of time for which JVM won’t allocate sufficient memory.
Let us now dive into some of the main causes for this error and the corresponding fixes for the same:
2.1. Java Heap Space
Problem
In Java, all the new objects are stored in the heap area of JVM, and the heap memory has a limited storage space. This error occurs when heap memory doesn’t have enough space to store new objects.
This can happen for various reasons:
- When we try to process a large amount of data or files which is too large into the application memory to store and process.
- When we keep references to the old objects (ones that we are not using anywhere in our application) and because of this, heap memory piles up with these old objects.
- When we have some programmatic loopholes, and there occurs a memory leak within our application code which fills up the heap memory unnecessarily.
Let us now look at an example to produce a Java heap space problem:
public class JavaHeapSpace {

  public static void main(String[] args) throws Exception {
    String[] array = new String[100000 * 100000];
  }
}
Here, we are trying to create a string array of quite a larger size, and with the default memory settings of JVM, this code on execution will raise OutOfMemoryError. This error indicates that there is not enough memory on the heap to assign this string array.
Exception in thread "main" java.lang.OutOfMemoryError: Java heap space
  at memory.JavaHeapSpace.main(JavaHeapSpace.java:5)
Solution
In most cases, increasing the maximum heap size will resolve this problem so that the JVM can allocate the required amount of memory to the program.
Two main JVM attributes that determine the Java heap size, and we can set them at JVM application startup settings:
-Xmsto set the initial heap size-Xmxto set the maximum heap size
For example, to increase the maximum heap size to 8 GB, we must add the -Xmx8g parameter to our JVM start parameters.
-Xms2G -Xmx8GThis fix will work only till this new memory space wouldn’t gets filled up again. Suppose we try to process some data or files larger than 8 GB then again our application will raise this error or in case our application has memory leaks or useless references then also we will run into the same problem for quite some time again.
For this, we have to go through our application code and find any potential memory leaks and remove useless references from our code to prevent the heap memory from filling up with unnecessary data.
2.2. GC Overhead Limit
Problem
This error occurs when Garbage Collector won’t able to reclaim memory despite running most of the time, meaning, JVM is spending approx. 98% of its time doing the garbage collection for 5 consecutive garbage collection cycles and still reclaiming less than 2% of the heap space.
We will usually get this error with older java versions with lesser heap memory and older implementations of Garbage collectors like Parallel GC or Serial GC.
Let’s now look at an example to produce GC overhead Limit error:
public class GCOverhead {

  public static void main(String[] args) throws Exception {
    Map<Long, Long> map = new HashMap<>();
    for (long i = 0l; i < Long.MAX_VALUE; i++) {
      map.put(i, i);
    }
  }
}
When we run the above code with a heap size of 50 MB and using Java version 8 that uses Parallel GC then we will get the below error,
Exception in thread "main" java.lang.OutOfMemoryError: GC overhead limit exceeded
        at java.base/java.lang.Long.valueOf(Long.java:1211)
        at memory.GCOverhead.main(GCOverhead.java:10)
Solution
We can resolve this type of error by increasing the heap size using -Xmx attribute so that JVM will have enough heap memory to meet our programming needs and it won’t run GC most of the time to reclaim the memory. We have to also use new implementations of GC that come up with new versions of Java to have better algorithms implemented for garbage collection.
-Xmx4G2.3. Array Size Limits
Problem
In a Java application, if we try to create an array of size greater than Integer.MAX_INT or if our array grows too big and ends up with a size greater than the heap memory size then we will get java.lang.OutOfMemoryError: Requested array size exceeds VM limit error.
For example, if an application attempts to allocate an array of size 1024 MB but the maximum heap size is 512 MB then this error occurs.
Solution
If we want to use an array of larger size then we have to increase the heap memory size using -Xmx attribute of JVM. We need to revisit our code as well to remove such situations where our array grows upto heap space, and we should come up with better memory management and data allocation measures in our code.
-Xmx4G2.4. Perm Gen Issues
JVM memory area is divided into 2 parts:
- Heap Space
- PermGen (Permanent Generation)
At the time JVM launches, the size of the Heap space and permgen sets up. Heap space stores all the newly created objects in Java whereas PermGen space keeps track of all the loaded classes metadata, static methods and references to static objects.
PermGen space size is limited in Java, we have a PermGen of size approx. 85 MB in a 64-bit version of JVM and because of that if we have lot many classes, static methods or references to static objects in the application then this limited PermGen space fills up and our application will raise java.lang.OutOfMemoryError: PermGen space error.
Since Java version 8, PermGen space removes from the JVM, and hence we won’t get this error anymore with java versions after JDK7.
Solution
We can resolve this error by increasing the size of the PermGen space by including -XX:PermSize and -XX:MaxPermSize JVM parameters.
-XX:PermSize128m
-XX:MaxPermSize512m
2.5. Metaspace Issues
As the PermGen space has been removed from JVM as part of the Java-8 release, all the class metadata is now been stored in native space also called metaspace which is part of the heap memory of JVM.
This metaspace region is still limited and can be exhausted if we have a lot of classes, resulting in raising java.lang.OutOfMemoryError: Metaspace error.
Solution
We can resolve this error by increasing the size of the Metaspace by adding -XX:MaxMetaspaceSize flag to VM arguments or parameters of our Java application. For example, to set the Metaspace region size to 128M, we would add the following parameter:
-XX:MaxMetaspaceSize128m2.6. Out of Swap
Problem
Operating-system level issues cause java.lang.OutOfMemoryError: Out of swap space error, such as:
- When the operating system configures with insufficient swap space.
- When another process on the system consumes all memory resources.
Solution
For resolving this issue, we have to check our operating system swap settings and increase if that is too low. We also need to verify if there are other heavy memory consumers running on the same machine as our application.
2.7. Number of Threads
Problem
There is a limit to creating and running threads in an application and java.lang.OutOfMemoryError: unable to create native thread error occurs when we hit the thread creation threshold and the operating system runs out of resources to create a new thread for our application.
Let us now look at an example to understand this error more clearly,
public class ThreadsLimits {

  public static void main(String[] args) throws Exception {

    while (true) {
      new Thread(
          new Runnable() {
            @Override
            public void run() {
              try {
                Thread.sleep(1000 * 60 * 60 * 24);
              } catch (Exception ex) {}
            }
          }
      ).start();
    }
  }
}
In this program, we continuously create new threads and put them to sleep. After some time, our code exhausts the operating system limits, and it can’t create more threads, and we will end up with the error,
Exception in thread "main" java.lang.OutOfMemoryError: unable to create native thread: possibly out of memory or process/resource limits reached
  at java.base/java.lang.Thread.start0(Native Method)
  at java.base/java.lang.Thread.start(Thread.java:802)
  at memory.ThreadsLimits.main(ThreadsLimits.java:15
Solution
To get rid of these kinds of issues, we should be careful while creating new threads in our application and we should create a new thread only when it’s been required and try to implement Thread Pools so that we can make use of same threads for multiple jobs instead of creating new threads for each and every operation.
3. How to Catch OutOfMemoryError
If a program raises OutOfMemoryError, then being a programmer we can’t do much regarding the lack of memory in our application. It is the system or server admin who can increase the heap memory of the application to resolve this error. But it is highly recommended to handle exceptions wherever it is possible like in cases where the lines of code raising this exception are known then it will be a good idea to handle this error.
To catch this error, we just need to surround the code that may cause memory issues within the try-catch block,
public class OutOfMemoryErrorExample {

    public void initializeArray (int size) {
        try {
            Integer[] arr = new Integer[size];
        } catch (OutOfMemoryError e) {
            //Log the error msg
            System.err.println("Array size too large :: "+ e);
          }
    }

    public static void main(String[] args) {
        OutOfMemoryErrorExample obj = new OutOfMemoryErrorExample();
        obj.initializeArray(100000 * 100000);
    }
}
Output:
Array size too large :: java.lang.OutOfMemoryError: Java heap spaceHere, as we know the lines of code that may cause OutOfMemoryError we have kept those in try-catch block so that in case this error occurs then it will be handled gracefully, and the program is terminated/continued normally.
4. Various Tools for Detecting OutOfMemoryError
Detecting OutOfMemoryError is not easy, and one has to investigate a lot to find out the root cause of this error. We can use various tools available in the market that helps us to analyze the objects that are taking a lot of memory in our application, or find any kind of memory leakages within the application. We can also set up alerts or alarming mechanisms as well in our logs which will trigger a notification in case OutOfMemoryError gets logged-in in our application logs.
Some of the popular tools for analyzing OutOfMemoryError are:
4.1. VisualVM
VisualVM is another command line JDK tool that monitors and troubleshoots applications running on Java 1.4+. It can monitor the application’s CPU usage, GC activity, heap and metaspace / permanent generation memory, number of loaded classes and running threads.
VisualVM can take and display the thread dumps for an immediate insight of what is going on in the target process to help with uncovering inefficient heap usage and debugging memory leaks.
4.2. Eclipse Memory Analyzer (MAT)
Eclipse Memory Analyzer is an Eclipse foundation tool that is used for analyzing the Java heap dump. It is used for finding the memory leaks and the classloader leaks in our application code.
We can take the heap dump of our application that may contain millions of objects and analyze the same using this tool to detect any memory leakages and identify the places where can reduce the object creations.
4.3. Visualgc
Visualgc (Visual Garbage Collection Monitoring Tool) is another popular tool that can be attached to the instrumented hotspot JVM.
It is mainly used to represent all the key data in a graphical manner, including class loader, JVM compiler performance data, and Garbage Collection which we can analyze and figure out the culprits for high memory consumption or any kind of memory leaks.
4.4. JProfiler
JProfiler is a popular Java profiler tool in the market. It provides an intuitive UI for viewing system performance, memory usage, potential memory leaks, and thread profiling.
Using this tool, we can easily track performance issues and optimize our Java application. It is a cross-platform tool and various operating systems like Windows, Mac OS, Linux, Solaris, etc. support it. It also supports different IDEs such as NetBeans, Eclipse, IntelliJ, etc.
This tool provides many features such as Memory Profiling, Heap Walker, CPU profiling, Thread Profiling, Databases, etc. to track the performance issue in different sections. It also provides support for both the SQL and NoSQL databases.
5. Conclusion
In this tutorial, we have learned about Java OutOfMemoryError and the answers to the following questions:
- What is OutOfMemoryError class in Java?
- What are the various causes and corresponding fixes for OutOfMemoryError?
- How to catch OutOfMemoryError in our application code?
- Various tools by which we can analyzeOutOfMemoryError and remove memory leaks and improve the application’s performance.
Happy Learning !!